
How we halved our memory consumption in Rails with jemalloc
CARMEN CHUNG
10 October 2018
One of the earliest projects I was involved in at Valiant was investigating ways to optimise performance and memory consumption in our Rails web application. Although I had heard the age-old complaints about Rails applications being slow, bulky and prone to memory bloat, I had yet to come across any practical, easy-to-navigate solutions to these issues.
Until we discovered jemalloc.
In this blog post, I will be giving a brief overview of what jemalloc is; how to check your current Rails app’s performance and memory consumption (including testing to see whether you have a memory leak); how to install jemalloc locally and in production; and finally, show you what our end-results were after we switched to jemalloc (spoiler alert: we managed to halve our memory consumption in production!).
What is jemalloc?Ruby traditionally uses the C language function malloc to dynamically allocate, release, and re-allocate memory when storing objects. Jemalloc is a malloc(3) implementation developed by Jason Evans (hence the “je” initials at the start of malloc), which appears to be more effective at allocating memory compared to other allocators due to its focus on fragmentation avoidance and scalable concurrency support.
Step 1: Check your app’s memory consumptionIn order to determine whether switching to jemalloc actually has any positive effects on your Rails app, you first need to know how much memory is being consumed and how quickly the website responds. To check this locally, I added the following gems to the Gemfile (and did a bundle install):
gem "memory_profiler"
gem "derailed_benchmarks"
Note: you can run tests with these gems in the development, testing or production environments. If you want to run them in development / testing environments, make sure you remove the dotenv-rails gem from these environments in the Gemfile.
To determine the total memory used by each gem in the Gemfile, run:
bundle exec derailed bundle:mem
To only show files above a certain memory usage, add CUT_OFF=0.3 (or whatever figure you want as the cut off). Also note that because Ruby only requires files once, if the same file is required by several libraries, the cost is only associated with the first library to require the file (duplicate entries will list all the parents they belong to).
For example, a short excerpt of our results looked like this:
TOP: 70.2617 MiB
rails/all: 16.4805 MiB
rails: 6.1523 MiB (Also required by: active_record/railtie, active_model/railtie, and 8 others)
rails/application: 4.707 MiB
rails/engine: 3.543 MiB (Also required by: coffee/rails/engine)
rails/railtie: 3.293 MiB (Also required by: global_id/railtie, sprockets/railtie, and 3 others)
rails/configuration: 3.1484 MiB (Also required by: rails/railtie/configuration)
active_support/core_ext/object: 3.0469 MiB (Also required by: paper_trail/has_paper_trail)
active_support/core_ext/object/conversions: 2.5078 MiB
active_support/core_ext/hash/conversions: 1.8945 MiB (Also required by: active_record/serializers/xml_serializer, active_model/serializers/xml)
active_support/time: 1.7031 MiB (Also required by: active_record/base)
active_support/core_ext/time: 1.625 MiB
active_support/core_ext/time/calculations: 1.5391 MiB (Also required by: active_support/core_ext/numeric/time, active_support/core_ext/string/conversions)
active_support/core_ext/time/conversions: 1.1094 MiB (Also required by: active_support/core_ext/time, active_support/core_ext/date_time/conversions)
active_support/values/time_zone: 1.0664 MiB (Also required by: active_support/time_with_zone, active_support/core_ext/date_time/conversions)
tzinfo: 0.8438 MiB (Also required by: et-orbi)
tzinfo/timezone: 0.3867 MiB
(Note: 1 Mebibyte (MiB) = approximately 1.05 Megabytes.)
Additionally, in your production environment, you can see the number of allocated objects created (by location, as well as by gem) when dependencies are required by running:
bundle exec derailed bundle:objects
Below is a sample of the number of objects created by our gems:
348351 activesupport
66931 erubis
54842 json
23655 addressable
15078 bundler
14833 heroics
13313 ruby
13034 haml
7186 actionpack
6370 sass
In order to check to see whether you have a memory leak in a production environment, you can run:
bundle exec derailed exec perf:mem_over_time
This command sends numerous requests to the app and profiles memory usage over time - if you have a true memory leak, the memory use will continue increasing; if you do not have a memory leak, usually you will see app memory use increasing until it hits a "plateau", then peters off.
Remember that results vary (and seem to vary a bit when running say 2,000 tests compared to 20,000 tests). By running the tests a number of times, we discovered that on average, our app's plateau seemed to occur around the 1.7 MiB - 1.8 MiB mark. This seemed to roughly correspond with our Heroku logs, which showed a plateau around the 1.6 MiB mark.
💡PRO TIP: To set the number of tests you want to run rather than let it run forever, you can use:Step 2: Check your app’s performance and speed
TEST_COUNT=20_000 bundle exec derailed exec perf:mem_over_time.
To check the overall efficiency of your application, you can hit an endpoint in the application using benchmark-ips (that is, benchmarking a block of code’s iterations per second) with this command:
bundle exec derailed exec perf:ips
A higher value is better as it means more iterations of the code block per second. A few of our results are as follows:
Warming up -------------------------------------- ips 1.000 i/100ms Calculating ------------------------------------- ips 5.070 (± 0.0%) i/s - 26.000 in 5.141956s Warming up -------------------------------------- ips 1.000 i/100ms Calculating ------------------------------------- ips 5.162 (± 0.0%) i/s - 26.000 in 5.051505s Warming up -------------------------------------- ips 1.000 i/100ms Calculating ------------------------------------- ips 4.741 (± 0.0%) i/s - 24.000 in 5.125214sStep 3: Install Jemalloc (locally and in production)
To install jemalloc locally, simply add this to the Gemfile and bundle install:
gem 'jemalloc'
Note: if you use rvm (and have already installed Ruby 2.4.1), run rvm reinstall 2.4.1 -C —with-jemalloc to reinstall Ruby with jemalloc.
To check that your version of Ruby uses jemalloc, run:
ruby -r rbconfig -e "puts RbConfig::CONFIG['LIBS']".
Your response should be something like:
-lpthread -ljemalloc -ldl -lobjc
(The -ljemalloc means jemalloc is loaded when starting Ruby.)
But what about in production? There are a few ways to add jemalloc in Heroku, but we found that the easiest way was to just add the buildpack with this command:
heroku buildpacks:add --index 1 https://github.com/mojodna/heroku-buildpack-jemalloc.git --app [your app name here]
To confirm that it has been installed, run heroku buildpacks --app [your app name here], and you should see the buildpack listed.
Alternatively, you can add the buildpack in Settings → Buildpacks → Add buildpack in the Heroku dashboard.
Step 4: Check results locallyRun the same commands as in Step 1 to check memory consumption and speed post-jemalloc. Our results showed a 8.6953 MiB (9.117 MB) — which is 12.38% — saving of memory over the entire app. For allocated objects by location, we saved 5,064 MiB (5,310 MB) of memory.
Step 5: Check results in productionWe used siege, an http load testing and benchmarking utility, to overload our review applications with requests (stay tuned for our upcoming post on how to do this!). Without jemalloc, we found that we were averaging around 2.5 transactions per second, with an average of around 160 failed transactions during a 20 minute timeframe. With jemalloc, we ended up with an average of 6.6 transactions per second, and only 1.5 failed transactions during a 20 minute timeframe.
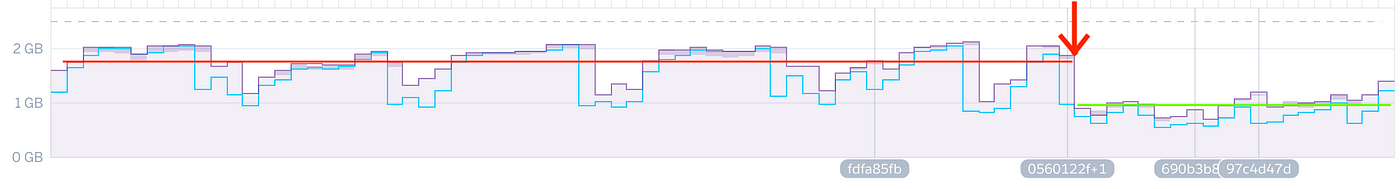
Most impressively, our Heroku dashboard results showed remarkable, almost immediate improvements. Prior to jemalloc, our memory usage would hit around 2 GB before being automatically force-restarted. After jemalloc, our memory usage dropped down to the 1 GB mark, avoiding the force-restart entirely.
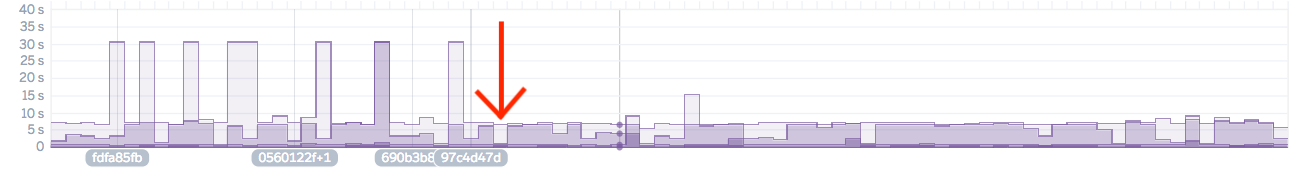
Similarly, our response times to requests showed rapid decline — prior to jemalloc, some requests were taking as long as 30 seconds. Afterwards, our response times dropped to around 5–10 seconds.
Conclusion
We had incredible, tangible performance and memory consumption benefits after implementing jemalloc; and while this may not be the silver bullet to combat Rails’s reputation in the industry for sub-optimal garbage collection, it certainly helped us optimise our platform.
← GO BACK